JAMMU AND KASHMIR:
|POPULATION DISTRIBUTION, 1981 AND SUBSEQUENT GROWTH
The distribution of population in the area of the erstwhile princely state of Jammu and Kashmir is, to a very large degree, contingent on the factors of physical geography discussed in respect to the foregoing general reference map. Figure 3 provides a map of that distribution, by districts, as of 1981, the date of the most recent censuses conducted by India and Pakistan on their respective sides of the Line of Control. Although the total population has increased substantially since that date, the regional pattern of relatively high, medium, and low densities will have altered little.
Figure 3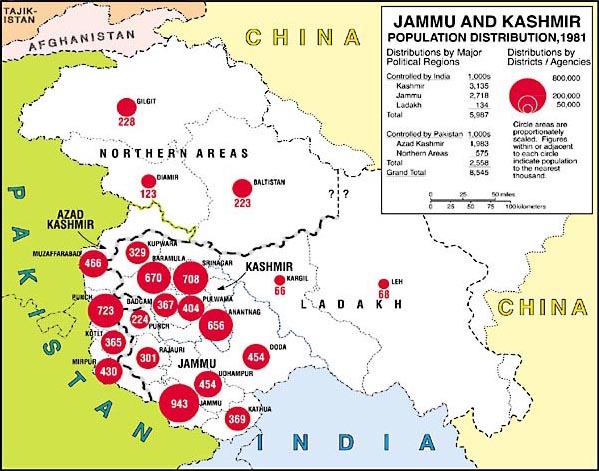
Generally speaking, the areas comprising Indian-held Kashmir proper and Jammu, and Pakistani-held Azad Kashmir are areas in which the densities range from medium to very high, while Ladakh and the Northern Areas are sparsely settled. Regional area and population totals for 1971 and 1981 and1981 densities are indicated in the table below. At the district level, 1981 densities ranged from a high of 824 per square mile (318 per square km.) in Srinagar and 790 per square mile (305 per square km.) in Jammu to a low of 1.2 per square mile (0.47 per square km.) in Leh.
| Region |
Area
|
Population
|
Density,
1981
|
||
| (sq. mi.) | (sq. km.) | 1981 (x 1,000) | per sq. mi. | per sq. km. | |
|
|
|||||
| Indian-held areas | |||||
| Kashmir | 6,049 | 15,668 | 3,135 | 518 | 200 |
| Jammu | 9,997 | 25,891 | 2,718 | 272 | 105 |
| Ladakh | 15,597 | 40,395 | 134 | 9 | 3 |
|
|
|||||
| Total | 31,643 | 81,954 | 5,987 | 19 | 7 |
| Pakistani-held areas | |||||
| Azad Kashmir | 4,871 | 12,616 | 1,983 | 407 | 157 |
| Northern Areas | 32,792 | 84,931 | 575 | 18 | 7 |
|
|
|||||
| Total | 37,663 | 97,547 | 2,558 | 68 | 26 |
| Chinese-held areas | |||||
| Aksai Chin | 14,500 | 37,555 | * | — | — |
| Shaksgam | 2,000 | 5,180 | * | — | — |
|
|
|||||
| Total | 16,500 | 42,735 | * | — | — |
|
|
|||||
| Grand total | 85,806 | 222,236 | 8,545 | 100 | 38 |
| *signifies virtually no permanent habitation | |||||
In the years since the partition of the state of Jammu and Kashmir, the rate of population growth in the Pakistan-held areas has been somewhat higher than in those held by India. But, because of significant migratory streams into and out of various areas of the erstwhile state, the effects of internal conflict, changes in vital rates, and other factors, it is difficult to project reliable population figures for the present date (the year 2000). Rough estimates (in millions) may, however, be offered, as follows:
| Indian-held areas | |
| Kashmir 4.70 m., Jammu 4.55 m., Ladakh 0.20 m. | Total 9.45 m. |
| Pakistani-held areas | |
| Azad Kashmir 3.10 m., Northern Areas 1.10 m. | Total 4.20 m. |
|
|
|
| Grand total 13.65 m. |
The estimated grand total represents an increase of about 60% since 1981 and of 239% since the last pre-independence census in 1941, when the total population of the state was 4.022 m.